Focus, consistency, discipline and the will to win are essential ingredients for trading success. I have received numerous questions on various techniques from trading retracements, using moving averages, other indicators etc. I highly recommend that when starting out explore everything. Try out the indicators, trade breakouts, retracements etc. Backtest everything! Then find the method that suits your personality and apply 100% focus to that method. Only then can mastery of a method be achieved. I trade breakouts and breakouts only. This is my trading niche! For me, trading breakouts offers a very disciplined, low-risk approach to trading. It can for you too, provided you already have an excellent money management plan in place.
If you are serious about trading breakouts then I highly recommend the book “Day Trading With Short Term Price Patterns and Opening Range Breakout,” by Toby Crabel. This is one of the few trading books written by a successful trader. Many regard his book as the “Bible of Trading Breakouts.”
William "Toby" Harrison Crabel is a United States self made millionaire commodities trader. The Financial Times called Crabel "the most well-known trader on the counter-trend side." He is the fund manager of "Crabel Capital Management". Mr Crabel currently manages 1.6 billion dollars and is a producer of consistent returns whatever the weather. Crabel avoided having a losing year from 1991 to 2002. In 2005 the Absolute Returns Survey ranked his fund 101 out of 172 funds. Today his firm continues to do well.
Toby Crabel in his book states “Opening Range Breakout is one of the most important indicators of daily market direction that a trader can utilize.” I have every reason to believe him.
The Global Financial Markets have seen exciting action and extreme volatility over the last 48 hours. The catalyst for this volatility has been uncertainty in the financial markets relating to Dubai’s $60 billion debt. The markets do not like uncertainty. Did anyone see what happened to the London Stock Exchange on Thursday Nov 26… According to Reuters “The London Stock Exchange (LSE.L) halted trading for more than three hours on Thursday because of technical glitches, while it placed all order-driven securities in an auction call period. Trading resumed at 1400 GMT, following an auction call period that started shortly after 1030 GMT.
What transpired before trading was stopped? The market had just dropped 4.5%! To use the excuse of technical glitches… that’s a nice one... If trading was not halted I suspect we could have seen a 20-30% drop.. a crash! It’s a good thing the US markets were closed for Thanksgiving.. A blessing.
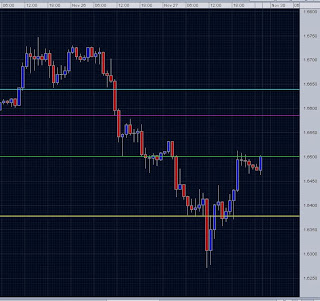
Due to other commitments, I was not around to trade. However, there were 4 excellent trading opportunites on my favourite currency pair GBPUSD over the last 2 days. See chart below with explanations of colour coded breakout levels. The action this week is great news for all of us. Why? Because usually, trading winds down for the Christmas period.. No such thing now! There will be extreme volatility and lots of action in the markets for the month of December. Lets make some pips!
Cyan Line - 1-2-3 formation breakout-reversal trade
Entry @ 1.6640
Purple Line - UK opening range breakout -continuation trade
Re-entry @ 1.6580
Green Line - US opening range breakout -continuation trade
Re-entry @ 1.6495
Yellow - Previous days low breakout -continuation trade
Entry @ 1.6370
What do these lines represent?
Hint.. These lines are related to my previous post.
NB. Kindly post questions on this blog so that others can benefit from the question and response.
In my previous post titled “Supply and Demand,” I asked the question: What is the relationship between trading breakouts and understanding Supply and Demand levels.. any takers?

No comments:
Post a Comment